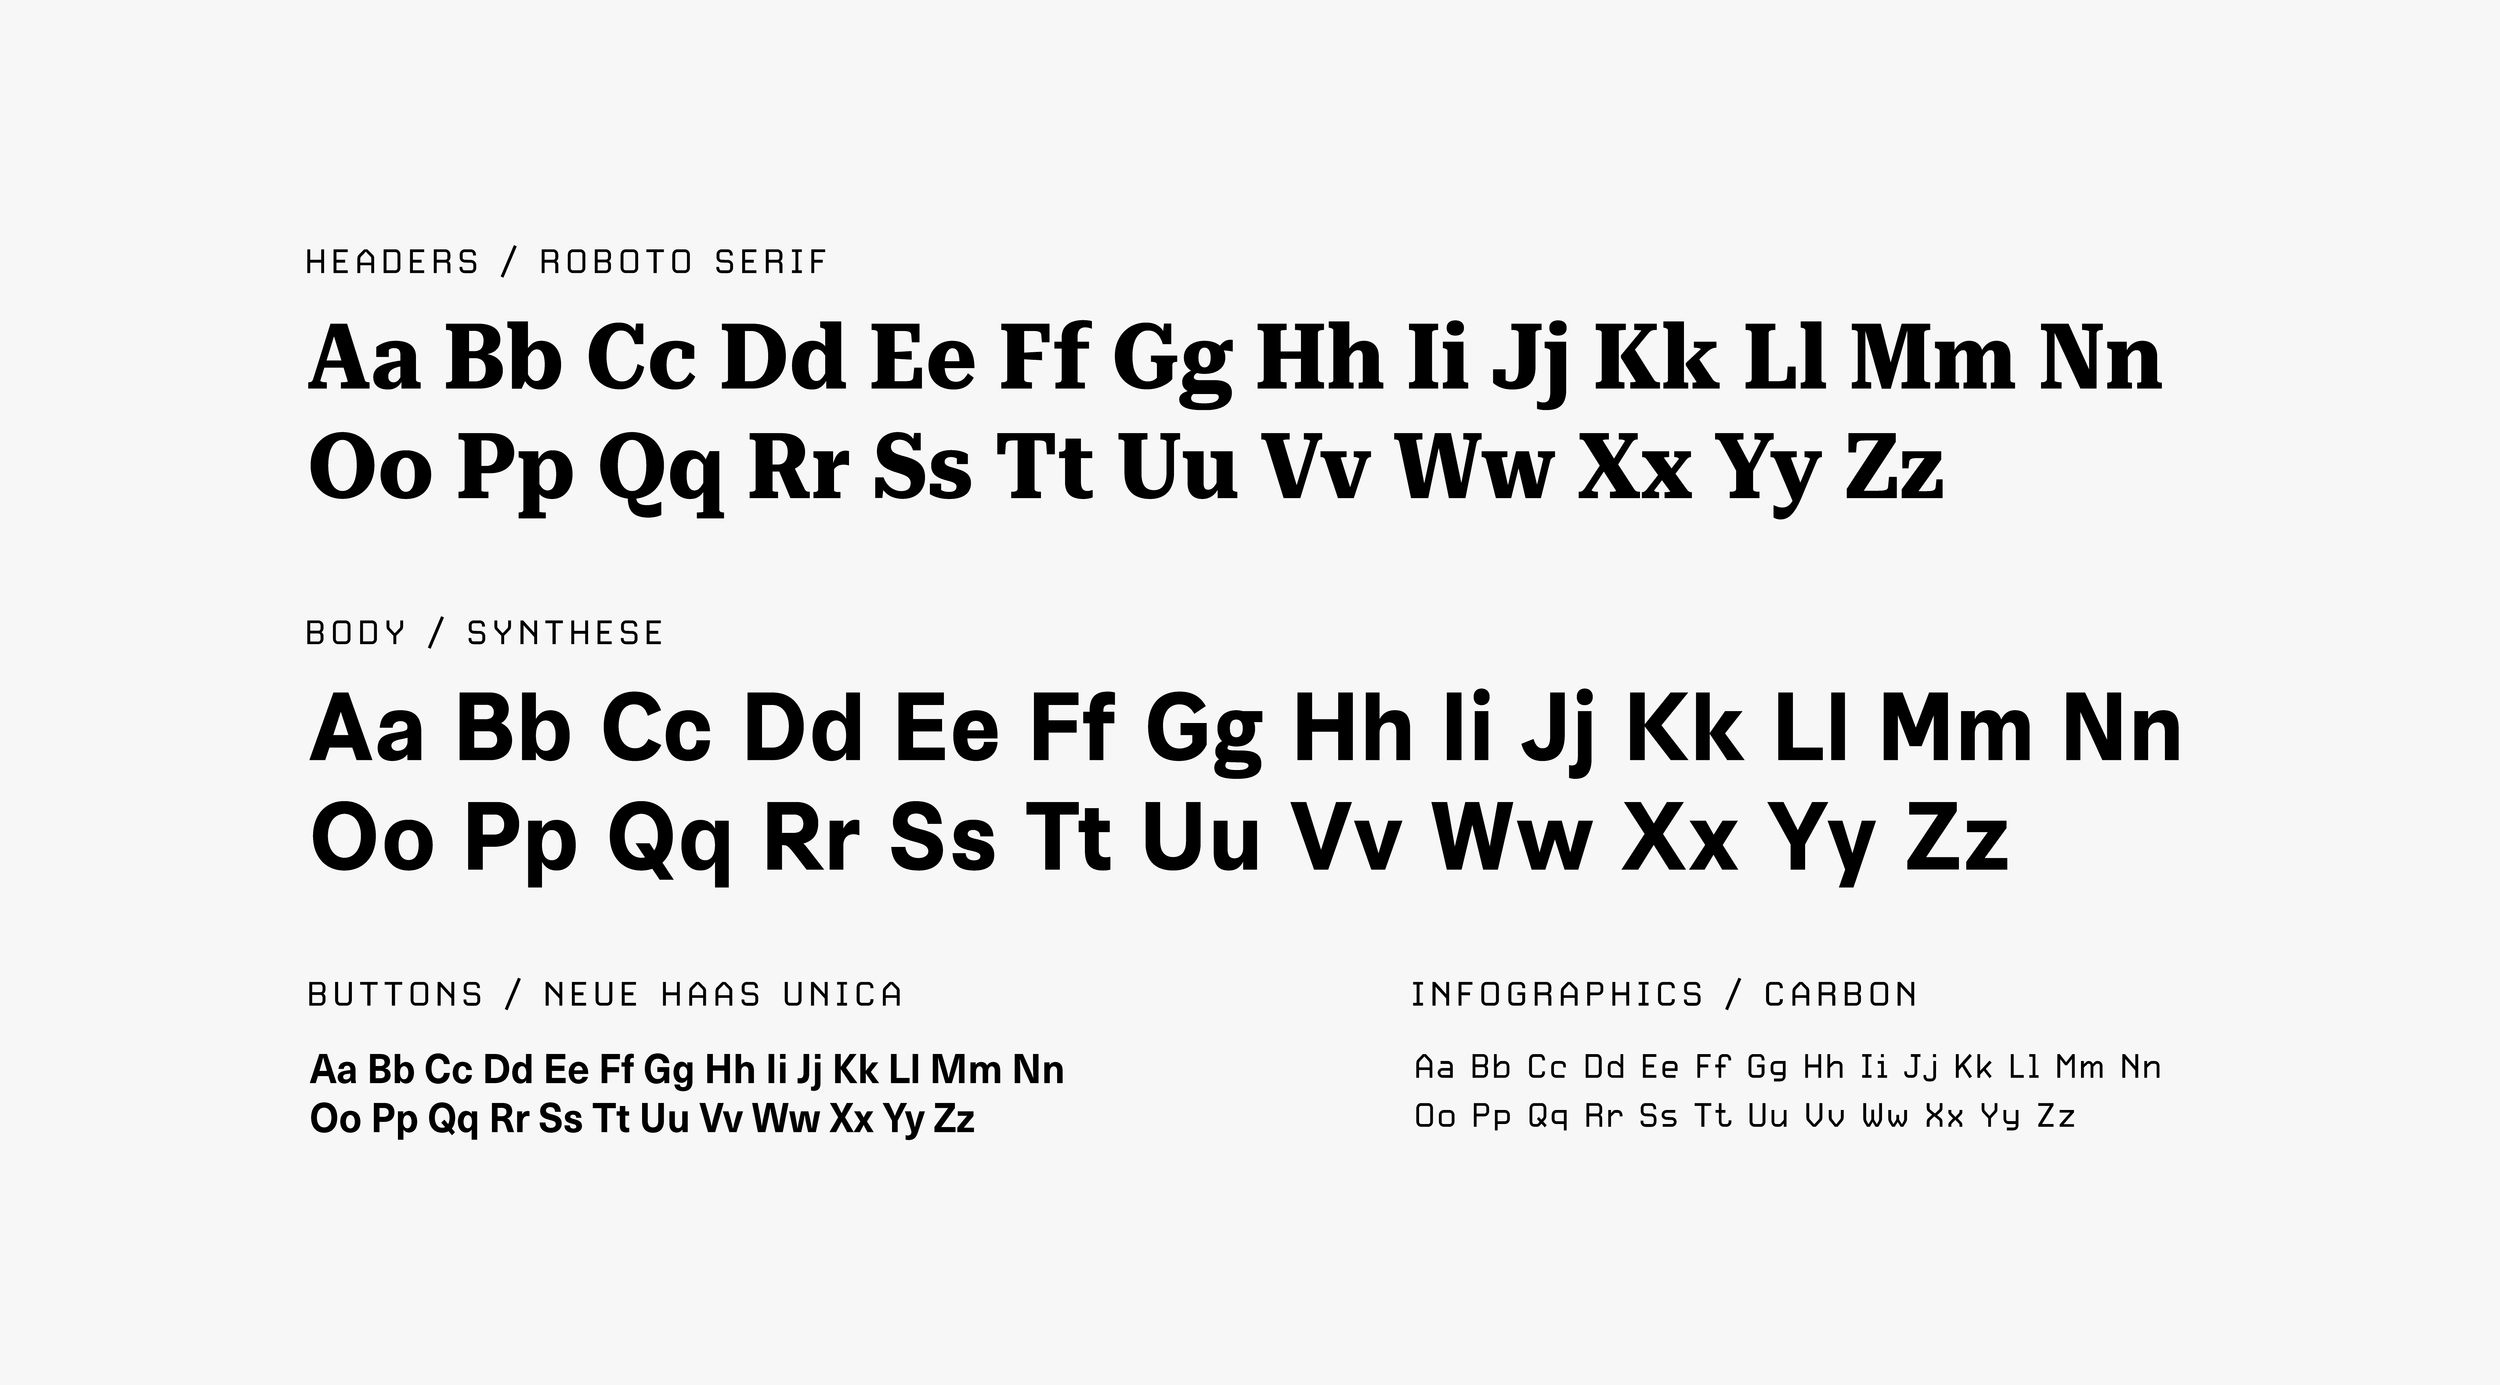
The goal was to create a gritty, informative aesthetic that aligned with the brand's mission. Inspired by newspaper textures and layouts, as well as the redacted style of classified documents, this digital platform was designed to convey transparency, positioning itself as a trustworthy and reliable resource of critical, fact-checked information and insight. A comprehensive library, meticulously curated with research and documentation extracted from interviews, reputable journals and publications.
I focused on seamlessly integrating infographics into the visuals, ensuring that the information was not only compelling but also visually cohesive within the brand’s somber, straightforward style. The use of yellow in the color palette functions as a bold accent, creating contrast and drawing the reader’s attention, much like a highlighter, to emphasize key details.
Police Unions Exposed
Project Role: Design Lead
Year: 2019
Brand & Identity, Editorial Design, Logo Design, Photo Editing, Web Design, UI/UX Design (in progress)

Problems & Challenges
Who will use this platform? Is it activists, legal professionals, or the general public?
Information overload: Too much data or text can overwhelm users.
Navigation issues: With potentially large amounts of information, it’s easy for users to get lost.
Trust and privacy concerns: Since police unions are a sensitive topic, users may be concerned about privacy and security.
Accessibility: Ensure that the website is accessible to people with disabilities.
User engagement: Keeping users engaged on serious topics can be difficult.
User Goals
Easy access to information on police union influence and keep up with the latest news, investigations and reforms.
The ability to find and use data, reports, and official legal documents for research and explore details.
Users can take action by engaging with their community, contacting their representatives, support reform efforts, spread awareness, and volunteer to assist in investigative efforts or organize local advocacy events.
Build and share knowledge with others.
Hold institutions accountable.
Ensure verified credibility, privacy and data are protected.
Key Features
Interactive Data Visualizations: Union influence map, misconduct aggregator and data dashboards.
Case Tracker: Live investigations and public submissions.
Advocacy Toolkit: Provide users with direct ways to advocate such as shareable content for social media and email, events calendar, volunteer opportunities, discussion boards, petitions, custom newsletter.
Impact Stories & Testimonials: Victims’ and whistleblower stories.
Educational Resources: Explainer videos, resource library, FAQs.
Transparency & Accountability Tools: Union contract database and display police union financial disclosures.

Photography should include authentic images of local citizens, allies, activists, political figures, law, and related landmarks and objects. Most imagery will be depicted as negative in order to emphasize police unions’ damage on society. Infographic elements is a key illustrative component in conveying statistics collected from research. Photo treatments are black and white collages with distressed halftones, and photocopy textures. Use yellow to add contrast and highlight important information.


